SWAN Market Perspective
2022’s market downtrend is continuing, and we are, once again, in bear market territory. Volatility in the markets fuels concerns that more could be on the way. Market corrections happen, it’s just been a while. While it’s entirely possible that this nasty ride in the market could last longer than we would all like, a long-term perspective combined with historical research provides optimistic insights into the future of your invested accounts. There are 6 charts to give you some perspective on what these developments could mean for you over the next few months ahead.
On this first graph, you can see that market corrections fuel bull markets. We have had six market corrections of 10% or more since 2009. Yet, the long-term bull run kept reaching new highs. The market doesn’t stop when there are corrections; it thrives on our ability to produce and keep a healthy economy.
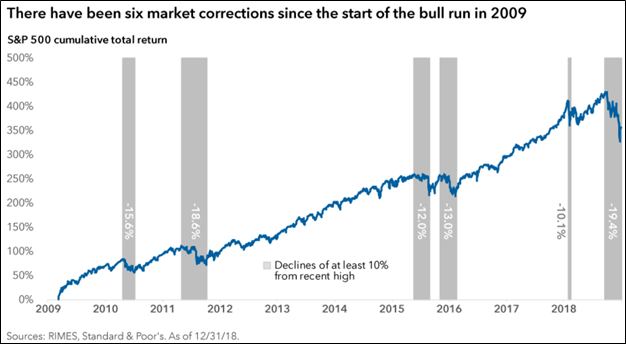
There are countless reasons for market declines: Interest rate increases, worsening economic data, political conflicts, war and much more. In 2022, while many of these factors played a role in the correction we are experiencing, they can easily be outweighed by long-term growth. The US experienced two world wars, a cold war, bubbles, financial crises, and pandemics, and every time, the stock market kept on going higher because of our willingness to fix issues and go forward.
One way to stay ahead is to not put all your money in the stock market. If there is a market pullback, then your other accounts will give you a comfortable hedge against these volatile times.
The chart below is another example. It shows that market corrections happen frequently. Market corrections are more common than people think.
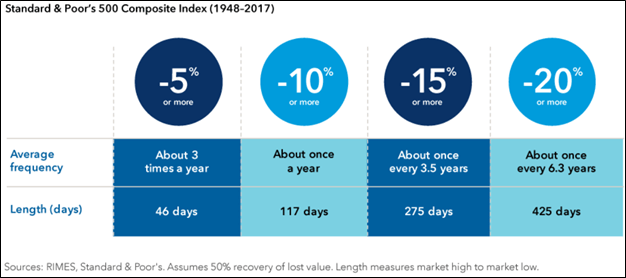
A 10% pullback happens about once a year, while a 5% decline happens about 3 times a year on average. That can feel unsettling, but corrections are common, and investors should handle this risk to produce long-term returns that make the roller coaster ride worth the trip.
The reason these corrections happen so frequently is that trillions of dollars are traded every year with each investor having a different goal and investing ideology in mind. Moreover, world news also moves markets and what happens is, most of the time, out of our control. If you avidly watch or read the news, this may be compounding your feelings.
How would I know this? Well, over the years I’ve had a lot of experience working with news outlets like CNBC, FOXBusiness, and Forbes… and trust me as an insider, their #1 goal is to drive revenue. They drive revenue by getting advertisers to pay them. They get advertisers to pay them by getting you and I to tune in… and the best way to get us to tune in is by dishing out negative news. We are fundamentally wired to pay more attention to negative news than positive news.
You can confidently turn off the news and approach your investments passively. By diversifying your investments among multiple account types and investment vehicles, correction won’t bring down your portfolio as much as others and may even create opportunities for you to jump in and invest in the market.
Market declines offer opportunities to invest in a recovery. The periods following corrections are historically substantial, as the graph below is displaying.
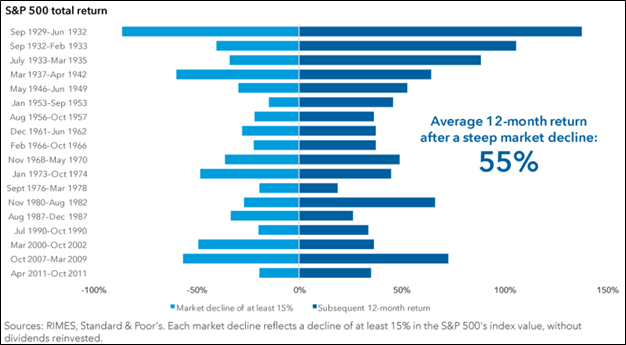
The average 12-month return of the S&P500 after a steep market decline is 55%. As we have seen above, market corrections happen often and when they do, we need to take advantage. Staying invested and even increasing your investments are very important for the long-term success of your plan.
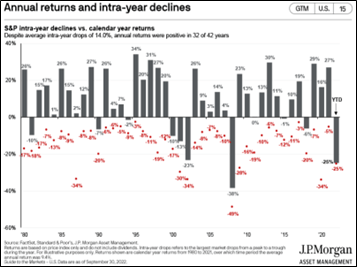
On a similar approach, we know that historically, even when the market is having a correction, it can end up positive within the same year. The market doesn’t stop when there is a correction. We can see intra-year declines and the market will still end up positive.
On another note, a low consumer confidence index often signals a bottom.
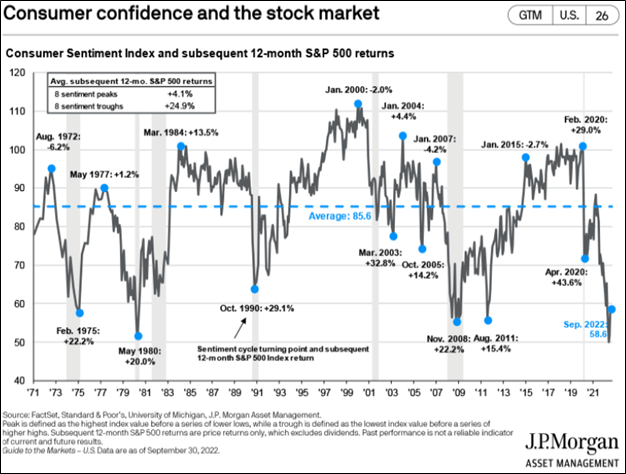
The above chart looks at S&P 500 performance after peaks and troughs in consumer sentiment. Interestingly, troughs in sentiment tend to precede stellar equity returns while peaks in sentiment don’t see as much upside. This underscores that getting out of the market when people feel crummy about the economy is an unwise investment strategy.
However, most people are not confident in the market right now. We are almost at the level of the 2008 financial crisis because many investors are reluctant to invest, but usually, the market has high returns after it has dropped significantly.
To conclude this long-term perspective on the market, this final chart points out that missing out on the best days will cost you.
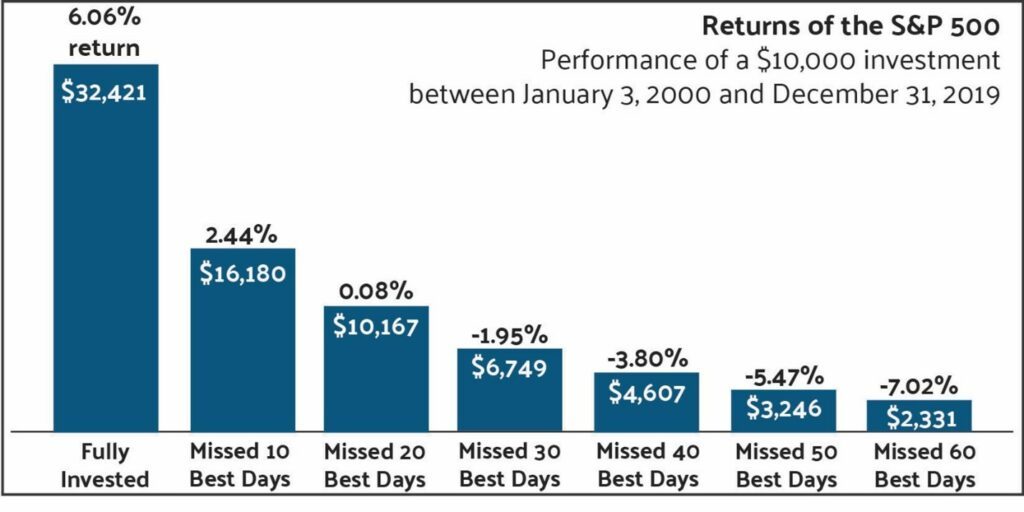
Nobody knows when the best days of the markets are, but we know how much returns you can miss out on. For example, if you missed the 10 best days, your returns would drop from 6.06% to 2.44%. Missing the best 20 best days will drop your returns to 0.08%.
If you’re finding yourself overly anxious about what’s going on in the world, remember, it’s never as bad as it seems. When market decline and volatility rise, this is when your retirement planning matters the most. By working with SWAN Capital, this is why we have built all-weather portfolios for our clients for such a time as this.
If you are concerned about your risk tolerance or if your advisor isn’t doing anything for you – telling you to “just hang in there”, then it’s probably time that we talk.
All investments are subject to risk including the potential loss of principal. No investment strategy can guarantee a profit or protect against loss in periods of declining values. This explanation/chart does not reflect any actual investment, and actual investment values will fluctuate. This illustration is intended to demonstrate mathematical principles and should not be regarded as absolute. Any decline in the market will result in the Rule of 72 becoming less effective as a tool. Information and opinions contained herein that has been obtained from third party sources is believed to be reliable however accuracy and completeness cannot be guaranteed. SWAN Capital is registered to conduct advisory business in Alabama & Florida and in other jurisdictions as permitted by law. Advisory services offered through SWAN Capital, LLC.. Neither the firm nor its agents or representatives may give tax advice. Individuals should consult with a qualified professional for guidance before making any purchasing decisions. Although there is no up-front tax deduction for Roth IRA contributions, qualified distributions are income tax free. Investing involves risk, including the potential loss of principal. Our firm does not provide and no statement contained in the guide shall constitute tax or legal advice. All individuals are encouraged to seek the guidance of a qualified tax professional regarding their personal situation. SWAN Capital is not affiliated with the U.S. government or any governmental agency.
Thought this info was useful?
Please share it on your social media platforms!
Ready to Take the Next Step?
For more information about any of our products and services, schedule a meeting today or register to attend a seminar.
 Download this 8-page guide was created for you to better understand how taxes could affect your retirement income.